Learning with Students: Resources for Making the World More Just With Mathematics
|
Numeracy is more than math. Numerate behavior involves managing a situation or solving a problem in a real context by responding to information about mathematical ideas that is represented in a range of ways and requires activation of a range of enabling knowledge, behaviors, and processes.
We can use math to explore and impact social justice issues in our lives and country. Our students live in the world, and by inviting them to explore what is happening around us, we allow them to bring their whole selves into our classrooms. We also give them space to make sense of the world in a learning community and show how math can be a tool in that sense-making. We can learn with our students how to use math as a tool to understand, reimagine, and when necessary, change our world.
Below is a growing collection of resources for engaging students in exploring social and political issues in math class.
(Note: Any text in blue is a resource link)
| |
What do you notice? How do you feel? What do you wonder? What will you do? Dr. Laurie Rubel
Notice. Feel. Wonder. Act.Dr. Benjamin Dickman
|
| |
 The Change Agent is a low-cost teaching resource that features writings by adult learners and supports adult educators and learners to make civic participation and social justice part of their teaching and learning. Each issue explores a different social justice topic. The Change Agent is a low-cost teaching resource that features writings by adult learners and supports adult educators and learners to make civic participation and social justice part of their teaching and learning. Each issue explores a different social justice topic.
For ideas about how to incorporate the Change Agent into your math class, visit The Change Agent (It's Not Just For ELA!)
|
First, Do No Harm
Adult basic education students often come from marginalized communities. Injustice is not abstract to them. Our students don't need us or math to tell them that things like racism, sexism, homophobia, transphobia, or xenophobia exist. But we can use math to analyze systemic oppression and structures with our students. But first, we must do no harm. As teachers we have to make sure our students are safe in these explorations.
|
Social Justice & Math: General Resources
- RadicalMath empowers educators to address issues of social and racial justice in math classrooms. They have a brand new website with curriculum, lesson planning resources, all of which can be searched by math content and/or social justice issue.
- Solving Word Problems - Equity & social justice in mathematics education from Frances Harper's website. "Teaching mathematics for social justice identifies two pedagogical goals: (1) high quality mathematics instruction for all students; (2) development of sociopolitical consciousness and praxis through mathematics study. Social justice teaching in mathematics focuses on promoting equity within the mathematics classroom, but also on empowering students to understand and confront inequities outside the classroom. It’s this second goal that this site is designed to help you with."
Identity: Who Does Math?
Social justice math is not about hardships. The resources in this section help us make space in our classrooms for the celebration, honor, and joy of culture, and explore the mathematical contributions and histories of our students.
- What's Your Math Story? by Amber Fornaciari - This thoughtful How-to article from the Math Practitioner (Spring 2020) describes the benefits and power of stories and offers suggestions for having adult learners write their own math story.
| |
What Exactly Is School Math for? Professor Filiberto Barajas-Lopez argues all cultures have rich mathematical traditions that we need to draw upon, asking two powerful questions: (1) Do our students feel like their own culture is reflected in the math they are learning? (2) What opportunities exist for them to develop lasting mathematical identities?
His work focuses on ways that teachers can amplify opportunities for immigrant and non-immigrant students of color to productively participate in school math and learn ways to expand the way we understand what kinds of math count.
|
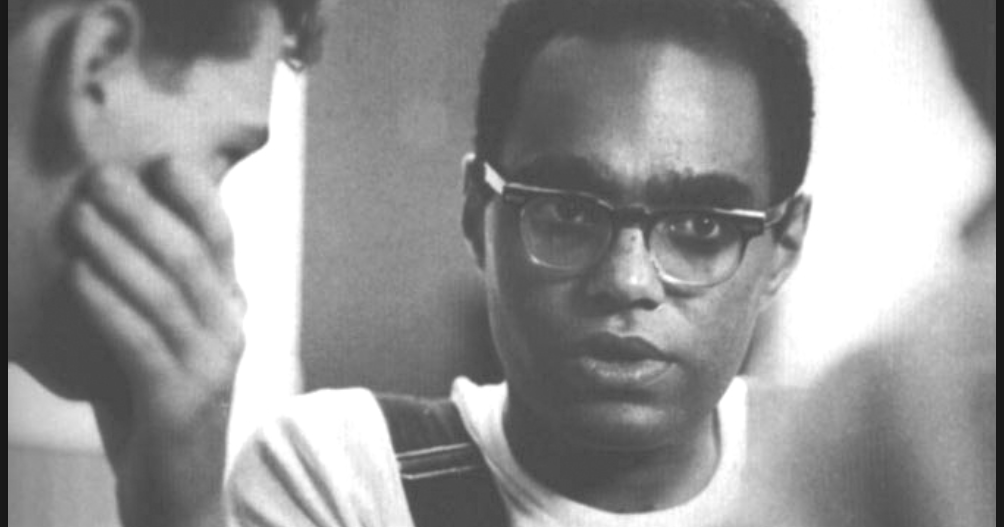
- Inspired by Ramon, Brian Palacios, a high school teacher in NYC created a book with his students' math writings: "Ramon’s book reminded me that math can and should be generative and full of original thinking. It reminded me that my students arrive to class each day bearing mathematical gifts. So while it is true that our students need mathematics, it is also true that mathematics needs our students. It needs their perspective, their ingenuity, their questions, their culture, their stories. More than anything, it needs their voice. I wanted my students to understand this. I wanted them to see that they mattered to math."
- Annie Perkins, a white middle school math teacher in Minnesota writes, "We as math teachers tend to only talk about white male mathematicians. Most of my students don’t look like that, and thus, they have few mathematical role models they can identify with. Take 10-15 minutes a week to research (read Wikipedia, that’s all you need) a not-old-dead-white-dude mathematician, and then take 5 minutes in class to tell your students about them. Include a picture. It’s worth it, I swear." To help other teachers answer her call, she created The Mathematicians Project with ready to use biographies and pictures. You can also learn about Annie's #MathArtChallenges in the Math Art Page of this website. Many of the activities involve mathematics rooted in place like Celtic Knots, Sona drawings, hitomezashi stitching, Islamic geometry, rangoli, and mandalas.
- Indigenous Mathematicians - This website seeks to put together all the known information about Indigenous Mathematicians. We recognize that Native People have been doing mathematics (and hence have been mathematicians) for millennia. However here, we use “mathematician” to mean someone formally trained in mathematics in the Western academic system and/or someone who practices mathematics in their profession. This site was recommended by Amy Vickers, WI because, "It may be helpful to normalize/ increase awareness of Indigenous mathematics and provide mentors for emerging mathematicians."
- Woke Math a blog by ESMathTeacher, one of the authors of the Seattle Public Schools K-12 Math Ethnic Studies Framework. "Methods are important. However, we do not need to center methods in class. We need to center stories. By centering stories in math class, we center humanity. When we center humanity we bring life back to mathematics."
- Interactive Timeline of Math History - This interactive and visual timeline is part of the Mathigon project. It allows students to scroll through human history and learn about contributions from cultures across the world.
| |
Recommended by Amy Vickers, WI who asks: "How can we connect with students' cultures to find math that is meaningful for them? I wish that formal adult education could be interwoven with the math that students could learn from an elder. The videos on the site show an example of how that could happen. How can you find out about the math that your students know and value?"
The playlist includes videos on scaling, making squares, making circles, comparing lengths algebraically, making thirds, clock partitioning, making protractor, and making a compass.
|
| |
Struggle to Success (3 minutes)
This is a brief introduction to Iranian mathematician Dr. Maryam Mirzakhani, who in 2014 became the first woman to win the Fields Medal (it was first awarded in 1936).
In the 6th grade she was so frustrated by a math test and math teacher that she stopped trying and gave up on math. The video describes Dr. Mirzakhani's path back into math being all about being able to make sense of it for herself, in her own way, which for her was through drawing & pictures. A powerful model for all learners, teachers and students alike.
|
Statistical Literacy & The Stories We Tell
In our information-based and data-driven world, statistics are power. The ability to understand, use, and analyze statistics is a civil need. Not to mention the ability to know when statistics are being used to manipulate information, often at the expense of marginalized people. Helping students create and reflect their own stories and communities through data and statistics allows them to become change agents in their own lives and communities. Making them informed-consumers of statistics can help them protect their hearts and minds.
Data Collections
-
Black Stats by Monique Morris - There’s no defeating white supremacist myths without data—real data. Black Stats is a compact and useful guide that offers up-to-date figures on Black life in the United States today, avoiding jargon and assumptions and providing critical analyses and information. Share These Stats About Black America with the Racist in Your Life (Mother Jones, Feb. 2014)
- LGBTQ Stats - LGBTQ Stats chronicles the ongoing LGBTQ revolution, providing the critical statistics, and draws upon and synthesizes newly collected data. Chapters on family and marriage, workplace discrimination, education, youth, criminal justice, and immigration, as well as evolving policies and laws affecting LGBTQ communities. A chapter on LGBTQ life around the globe looks at violent backlash in countries such as Russia, Iran, and Nigeria, which have discriminatory laws that make same-sex activity punishable by prison or death.
- Latino Stats - At a time when politics is seemingly ruled by ideology and emotion and when immigration is one of the most contentious topics, it is more important than ever to cut through the rhetoric and highlight, in numbers, the reality of the broad spectrum of Latino life in the United States. Latinos are both the largest and fastest-growing racial/ethnic group in the country, even while many continue to fight for their status as Americans.
| | |
Slow Reveal Graphs is an instructional routine for promoting sense-making in graphs. Classroom-ready slides with paired texts can be found here: Social Justice Graphs.
- Disproportionate Incarceration: ANN Past President Connie Rivera (CT) built a special collection of slow reveal graphs focused on a concept that fundamental to math & to justice - proportional reasoning.
- Crime & Punishment: A Tale of Changing Belief - by Jenna Laib (K-8 Math specialist, and creator of the Slow Reveal Graphs website) - "This is a story of how I changed a belief, first by learning from people who experience the world differently than I do, then through math/data. Both can be humanizing."
| |
Regional Data Many states and cities have publish data sets, graphs and tables looking at the places where we all work and go to school. Having students analyze and critique data about their own communities lets them understand how to use math and how math is used. A few examples are the NYC Community Health Reports or the Minnesota Compass site. If there are local data resources in your area, please let us know through the suggestion link at the bottom of the page.
|
Mona Chalabi is a data journalist (perhaps the only job title better than adult basic education teacher!), whose work is at the intersection of math, accessible data visualizations, public statistical literacy and justice. In addition to the resources below, she has several videos in the ANN Statistical Literacy playlist.
| |
ANN Statistical Literacy Playlist This growing collection of videos for students and teachers all deal with the importance of statistical literacy.
|
3 Questions to Ask Yourself the Next Time You See a Graph Chart or Map (The Conversation, July 2020) - This article by Carson MacPherson-Krutsky gives an overview of the ways graphs and charts can give us the wrong idea - either because they were sloppily made or because they are designed to be intentionally misleading. It shows examples of graphs and data on the Coronavirus.
The Math of Fairness and Representation
 The US Census: A Mathematical and Historical Perspective The US Census: A Mathematical and Historical Perspective - This lesson incorporates math and social studies in order to understand the history of the Census and the importance of participating in the count. Connections are made to American history, slavery, voting rights, literacy rates, congressional apportionment, branches of government, and population growth, as well as graph-reading skills and percents.
| |
Measuring Race & Ethnicity Across the Decades: 1790– 2010 The US government made very specific choices on how to racially categorize the population for each US Census form, changing it almost every 10 years. This interactive infographic timeline is a visual representation of the race and ethnic categories used on each US Census through 2010 and allows students to see who was counted, and who wasn't counted. 
|
| |
Which box do I check? (22 minutes) This episode from Mona Chalabi's podcast - Am I Normal? - goes deeper into representations of identity & data. We’re constantly checking boxes on forms, whether it’s for eye color or sexual orientation. Those categories can be empowering or, they can make you feel invisible, like when Mona painted a portrait of 100 New Yorkers based on the New York Census data, and realized she couldn’t see herself. There was no “Arabic” box to check in the census—the closest being “white” or “other.” So what happens when someone spends their whole life checking that box for “other”? Mona talks with nonbinary British Iraqi drag queen Amrou Al-Kadhi about embracing the contradictions of having multiple, wonderful, identities, that SOME people see as conflicting.
|
Mapping Segregation - This interactive tool from the NY Times uses US Census data to see maps of anyway in the US with a color-coded map based on the race of the residents of that area. This photo shows a wide-view map of New York City.
| | |
The Parable of the Polygons This website features a series of interactive game simulations to explore how segregation happens. The simulations show how small individual biases become large collective bias and look at the difference between being unbiased and demanding diversity.
| | |
GERRYMANDERING - Where math and democracy intersect, combining area, proportional reasoning, and representation.
- The Math of Congressional Apportionment and Hands-on Gerrymandering - A lesson/presentation by Kate Belin from the Fannie Lou Hamer Freedom High School
- Gerrymandering Math - an activity introducing gerrymandering created at an adult numeracy math teachers circle.
| | |
Picking Representatives - This mini unit comes from the Illustrative Mathematics 6th Grade Curriculum and is a great way to talk about what's fair and what's it means to be representative.
 Are there materials for teaching social justice math you think should be added? Are there materials for teaching social justice math you think should be added?
Please let us know - Social Justice Math Teaching Resource Suggestions.
|